Building Your SIEM: Part 6 - Adding Grafana for Advanced Visualization
Welcome to Part 6 of our SIEM construction series! Today we're adding the final piece to our visualization puzzle: Grafana. While we already have excellent dashboards in both Wazuh and Graylog, Grafana brings unparalleled flexibility and beauty to data visualization. Think of it as adding a state-of-the-art command center display system that can pull data from all your security tools and present it in stunning, customizable dashboards.
Why Add Grafana to Our SIEM Arsenal?
Grafana excels at creating unified dashboards that can combine data from multiple sources. It's perfect for executive reporting, NOC displays, and creating those impressive wall-mounted security dashboards that make your security operations center look truly professional. With Grafana, you can:
- Create stunning visualizations from multiple data sources
- Build executive-level security dashboards
- Set up advanced alerting with multiple notification channels
- Design custom panels for specific security metrics
- Create time-series analysis for trend identification
Step 1: Installing Grafana
Let's start by installing the necessary dependencies and adding Grafana's official repository:
sudo apt-get install -y apt-transport-https software-properties-common wget
sudo mkdir -p /etc/apt/keyrings/
wget -q -O - https://apt.grafana.com/gpg.key | gpg --dearmor | sudo tee /etc/apt/keyrings/grafana.gpg > /dev/null
echo "deb [signed-by=/etc/apt/keyrings/grafana.gpg] https://apt.grafana.com stable main" | sudo tee -a /etc/apt/sources.list.d/grafana.listWhat's happening here:
apt-transport-https: Enables secure repository connectionssoftware-properties-common: Provides tools for managing repositories- We're adding Grafana's GPG key to verify package authenticity
- Adding the official Grafana repository to our system
Now let's update our package list and install Grafana:
# Updates the list of available packages
sudo apt-get update
# Installs the latest OSS release:
sudo apt-get install grafanaThis installs the open-source version of Grafana, which is perfect for our SIEM needs and completely free to use.
Step 2: Creating SSL Certificates for Secure Access
Security is paramount in our SIEM, so let's set up HTTPS for Grafana using the same certificate infrastructure we've been building:
# Generate private key for the server
openssl genrsa -out grafana.key 2048
# Generate CSR (Certificate Signing Request)
openssl req -new -key grafana.key -out grafana.csr -config openssl-client.cnf
# Sign the certificate with the CA
openssl x509 -req -in grafana.csr -CA root-ca.crt -CAkey root-ca.key \
-out grafana.crt -days 3650 -sha256 -CAserial root-ca.srl -extfile openssl-client.cnf -extensions req_extCertificate Generation Process:
- Private Key: Creates a 2048-bit RSA private key for Grafana
- CSR Creation: Generates a certificate signing request using our existing OpenSSL configuration
- Certificate Signing: Uses our root CA to sign the certificate, valid for 10 years
Note: Make sure you're using the same openssl-client.cnf file we created in the previous parts of this series.
Step 3: Installing and Securing the Certificates
Now let's properly install these certificates where Grafana can access them:
# Create the certificates directory
sudo mkdir -p /etc/grafana/certs
# Copy certificates to Grafana's directory
sudo cp grafana.crt /etc/grafana/certs/
sudo cp grafana.key /etc/grafana/certs/
# Set proper permissions (note: this differs from the original command)
sudo chmod 644 /etc/grafana/certs/grafana.crt
sudo chmod 600 /etc/grafana/certs/grafana.key
# Set proper ownership
sudo chown grafana:grafana /etc/grafana/certs/grafana.*Security Note: I've corrected the permissions from the original chmod 444 to chmod 600 for the private key, which is more secure and follows best practices for private key files.
Step 4: Configuring Grafana for HTTPS
Let's configure Grafana to use HTTPS and set up our domain properly:
sudo nano /etc/grafana/grafana.iniFind the [server] section and modify it as follows:
#################################### Server ####################################
[server]
# Protocol (http, https, h2, socket)
protocol = https
# The public facing domain name used to access grafana from a browser
domain = bonsaii.local
# The HTTP port to use
http_port = 3000
# https certs & key file
cert_file = /etc/grafana/certs/grafana.crt
cert_key = /etc/grafana/certs/grafana.key
# The full public facing url you use in browser, used for redirects and emails
root_url = https://bonsaii.local:3000/Configuration Breakdown:
- Protocol: Set to HTTPS for secure connections
- Domain: Set to our consistent domain name
- Port: Grafana's default port 3000
- Certificates: Point to our newly created SSL certificates
- Root URL: Complete URL for proper redirects and links
Step 5: Starting Grafana Services
Now let's start Grafana and ensure it starts automatically on boot:
# Restart Grafana to apply our SSL configuration
sudo systemctl restart grafana-server
# Enable Grafana to start on boot
sudo systemctl enable grafana-server
# Check that it's running properly
sudo systemctl status grafana-serverIf everything is configured correctly, you should see Grafana running and listening on port 3000.
Step 6: Initial Grafana Access
You can now access Grafana via your web browser:
URL: https://bonsaii.local:3000
Default Credentials:
- Username:
admin - Password:
admin
Important: Grafana will prompt you to change the default password on first login. Make sure to use a strong password!
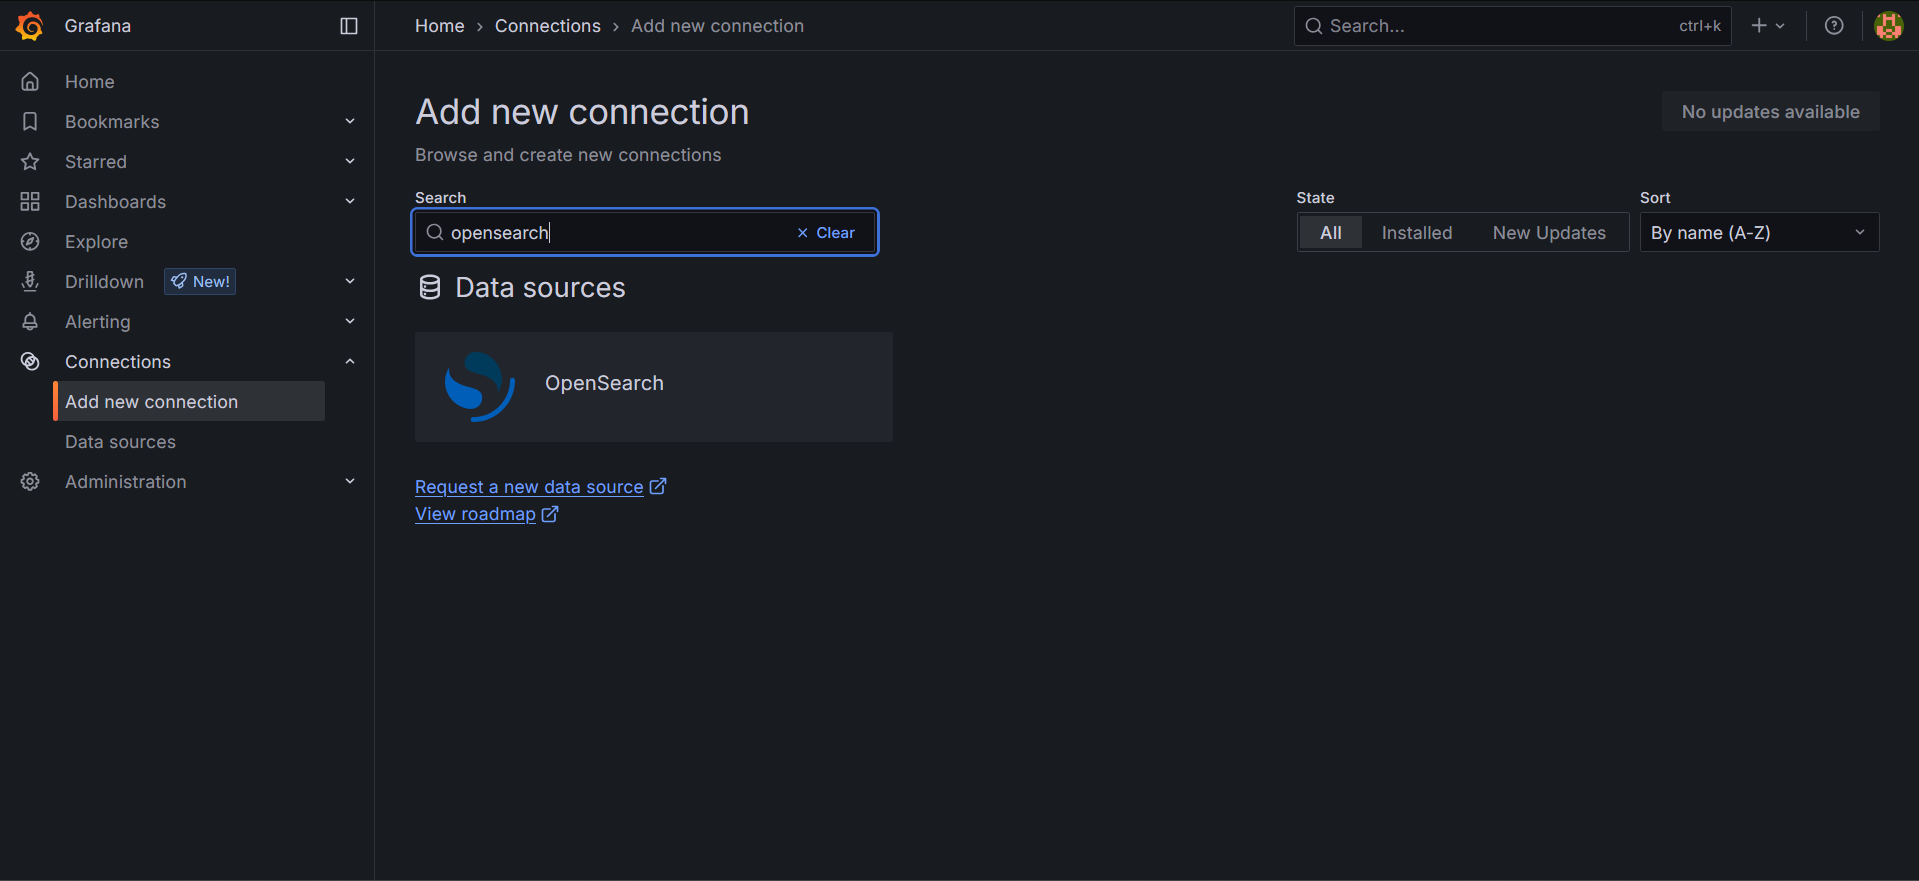
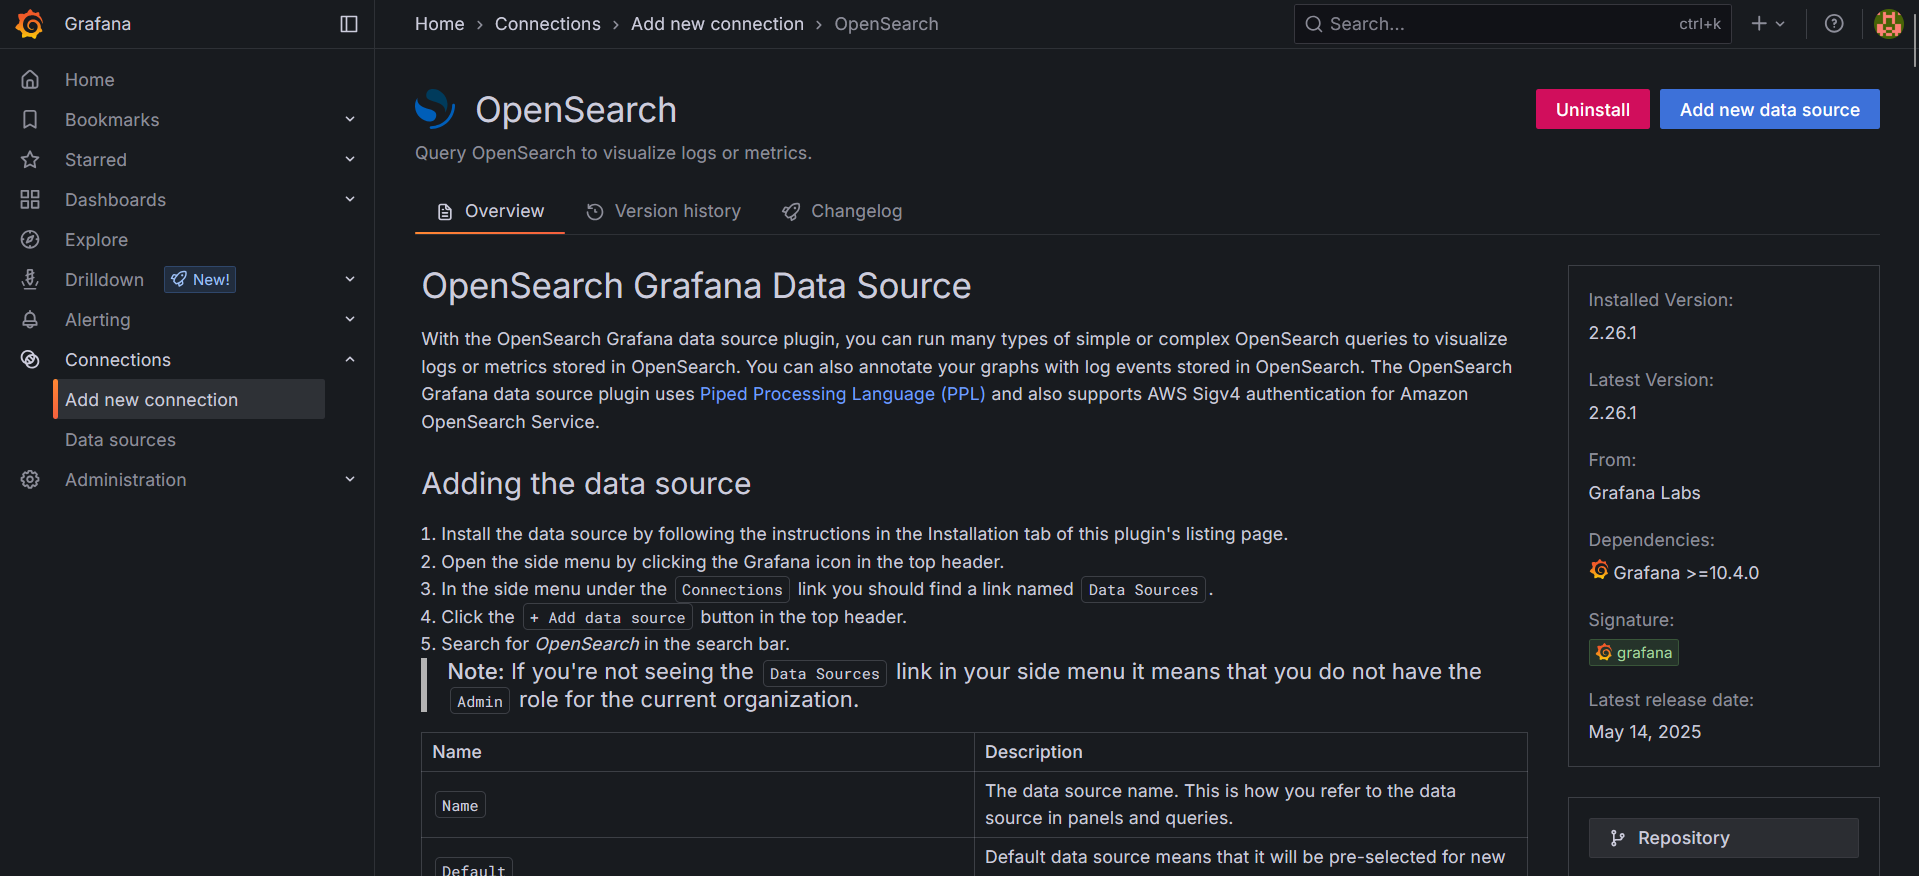
Step 7: Installing the OpenSearch Plugin
This is where the magic happens - connecting Grafana to our OpenSearch data. The OpenSearch plugin allows Grafana to query and visualize data from our security indices.
Installing the Plugin
# Install the OpenSearch data source plugin
sudo grafana-cli plugins install grafana-opensearch-datasource
# Restart Grafana to load the new plugin
sudo systemctl restart grafana-serverConfiguring the OpenSearch Data Source
- Log into Grafana at https://bonsaii.local:3000
- Navigate to Configuration > Data Sources (gear icon in the left menu)
- Click "Add data source"
- Select "OpenSearch" from the list
- Configure the connection:
Step 8: Creating Your First SIEM Dashboard
Now for the exciting part - creating visualizations! Here are some starter dashboard ideas:
Security Overview Dashboard
- Total Events Over Time: Line graph showing security event volume
- Top Source IPs: Bar chart of most active IP addresses
- Alert Severity Distribution: Pie chart of alert levels
- Failed Login Attempts: Time series of authentication failures
System Health Dashboard
- OpenSearch Cluster Health: Status panels
- Wazuh Agent Status: Agent connectivity metrics
- System Resource Usage: CPU, memory, and disk metrics
Step 9: Version Management
To prevent unexpected updates:
sudo apt-mark hold grafanaThis ensures Grafana stays at your current version until you manually decide to upgrade.
Advanced Configuration Tips
Custom Themes
Grafana supports custom themes that can match your organization's branding. Consider setting up a dark theme for your NOC displays.
User Management
Set up proper user accounts and permissions:
- Viewers: For stakeholders who need read-only access
- Editors: For security analysts who create dashboards
- Admins: For system administrators
Alerting Setup
Grafana's alerting capabilities are powerful. Configure alerts for:
- Spike in security events
- System component failures
- Unusual network traffic patterns
- Authentication anomalies
Integration with Your Existing SIEM Components
Data Source Connections
You can connect Grafana to multiple data sources simultaneously:
- OpenSearch: For Wazuh security data
- Graylog: Via Graylog's API
- System Metrics: Using Prometheus or InfluxDB
- External APIs: For threat intelligence feeds
Dashboard Organization
Structure your dashboards logically:
- Executive Dashboards: High-level security posture
- Operational Dashboards: Day-to-day security operations
- Incident Response: Specialized views for active investigations
- Compliance Reporting: Regulatory requirement tracking
Troubleshooting Common Issues
Certificate Errors
If you encounter SSL certificate issues:
# Check certificate permissions
ls -la /etc/grafana/certs/
# Verify certificate validity
openssl x509 -in /etc/grafana/certs/grafana.crt -text -nooutPlugin Installation Issues
If the OpenSearch plugin fails to install:
# Check plugin directory permissions
sudo chown -R grafana:grafana /var/lib/grafana/plugins
# Manually download and install
sudo grafana-cli --pluginUrl https://github.com/grafana/opensearch-datasource/releases/latest/download/grafana-opensearch-datasource.zip plugins install grafana-opensearch-datasourceConnection Problems
Test OpenSearch connectivity:
curl -k -u username:password https://bonsaii.local:9200/_cluster/healthSecurity Best Practices
- Change Default Passwords: Never use default credentials in production
- Enable HTTPS: Always use SSL/TLS for web access
- Regular Updates: Keep Grafana updated for security patches
- User Access Control: Implement proper role-based access
- Network Security: Use firewalls to restrict access to port 3000
- Session Management: Configure appropriate session timeouts
Performance Optimization
Dashboard Performance
- Use appropriate time ranges for queries
- Limit the number of panels per dashboard
- Optimize query intervals
- Use template variables for dynamic dashboards
System Resources
- Monitor Grafana's memory usage
- Configure appropriate cache settings
- Consider using a reverse proxy for better performance
What You've Accomplished
Congratulations! Your SIEM now includes:
- Grafana with secure HTTPS access
- OpenSearch integration for security data visualization
- Professional dashboards capability
- Advanced alerting infrastructure
- Multi-source data correlation potential
Final Thoughts
The addition of Grafana completes the core visualization layer of your SIEM. You now have multiple complementary tools:
- Wazuh for security-focused analytics and agent management
- Graylog for powerful log search and basic dashboards
- Grafana for beautiful, flexible visualizations and executive reporting
This multi-tool approach provides redundancy, specialized capabilities, and the flexibility to present security data in the most appropriate format for different audiences.
Stay tuned for more exciting SIEM building adventures as we continue to enhance and optimize our security monitoring platform!